The East Brainerd-Area 11-Plan is now official. The Chattanooga City Council adopted the Plan on Tuesday, August 23rd. The full document is available at the link below.
This Area Plan is now a guiding document for growth, redevelopment, and conservation in the East Brainerd area. The staff will continue to work with your elected officials, other City departments, and East Brainerd residents and business owners to promote the implementation of the Plan’s recommendations.
Thank you to everyone who attended workshops, took surveys, and provided feedback during this process.
CHAPTER SUMMARIES
These 8 exhibits provide a summary—by chapter—of the community input we have received, important statistics, and key recommendations from the Plan, along with some maps and illustrations.
WALKABILITY VIDEO
Check out the WALKABILITY VIDEO!
When surveyed, East Brainerd residents said they wanted to see more walkable commercial centers (similar to Cambridge Square in Ooltewah.) Think about your experiences as a pedestrian in places such as Gunbarrel Road. Are you inclined to park once and walk to multiple stores in that area? Would you like to have better connections from your neighborhood to parks and commercial centers?
In this short video, you will learn what it takes to make places like the Gunbarrel Road corridor more walkable.
If you are new to the planning process, click on the squares below to read the Existing Conditions Report, see previous Survey Results, and more. And make sure to Sign up for Email Updates if you have not already done so. Thank you for your interest and participation!
COMMUNITY CHOICES SURVEY RESULTS
Residents and business owners in Area 11 completed a total of 581 surveys focused on four topics:
Housing, Commercial Development, Traffic & Transportation, and Natural Systems, Parks & Greenways.
Click the button below to see the results.
Everyone who completed all four surveys was entered in a prize drawing and four of those people won
$25 Amazon gift cards. Congratulations to the winners.
You can still read the accompanying Background Information that went with each survey by clicking on
the buttons below.
You can also find more detailed information on these topics in the Area 11 Existing Conditions Report.
KICK-OFF SURVEY RESULTS
The Area 11 Kick-off Survey closed March 1 with 272 responses. A summary of the Survey results can be found at the button below.
JULY PANEL DISCUSSIONS
Housing and Commercial Development
Thursday, July 8th
Recording of the Meeting
Transportation
Thursday, July 22nd
Recording of the Meeting
Parks, Greenways & Natural Resources
Thursday, July 29th
Recording of the Meeting
---
Go to the Top
KICK-OFF MEETINGS!
Both meetings were recorded and can be accessed by clicking on the links below. The presentation was the same at both meetings, but the Q&A sessions at the end are obviously different.
Wednesday, February 17 Kick-off Meeting click HERE
passcode: MX5R+XK8
Monday, February 22, Kick-off Meeting click HERE
passcode: 0hD!+SKa
---
Go to the Top
FREQUENTLY ASKED QUESTIONS (FAQ)
---
Go to the Top
INTERACTIVE MAPS
What places do you love? What places aren’t working so well? Where do you see opportunities for a place to be better used? Use the button below to place pins on specific locations in East Brainerd. You can “pin” multiple locations.
Are you looking for a map showing all commercial or housing development, parks, transit routes, or flood zones? Zoom in and out, and toggle on and off layers, to learn more about the Area 11 community.
(Click here to go to map website.)
Go to the Top
---
STAY INVOLVED
Click one of the icons below to sign up for the Area 11 email list, or to submit any comments about Area 11. Once you sign up for the Area 11 email list, you will start receiving periodic updates, including survey results, notices of upcoming meetings, and other current information about the Area 11 Plan.
1 | Subscribe
Subscribe to the E-mail List!
2 | Comment
Write on the Comment Board
(Didn’t feel like the survey covered an important issue? You can also tell us more about your community by clicking on this link.)
---
Go to the Top
EXISTING CONDITIONS REPORT
The Area 11 Existing Conditions Report contains helpful information about demographic and development trends, transportation, floodplains, parks and greenways in the East Brainerd area.
Click on the links below for highlights from the Report.
Demographics and Housing
Existing Conditions: Report Chapters 2 and 4
The demographic makeup of a community (e.g. seniors, families, single householders, householders with no children) can have a significant impact on the housing and amenities desired. Below are a few highlights of the demographic trends in Area 11 and the potential impacts to housing needs.
Population and Housing
- Area 11 has 21,400 residents.
- The population grew by 1.62% from 2010 to 2017.
- If this growth rate continues, in ten years there would be roughly 4,000 new residents in Area 11.
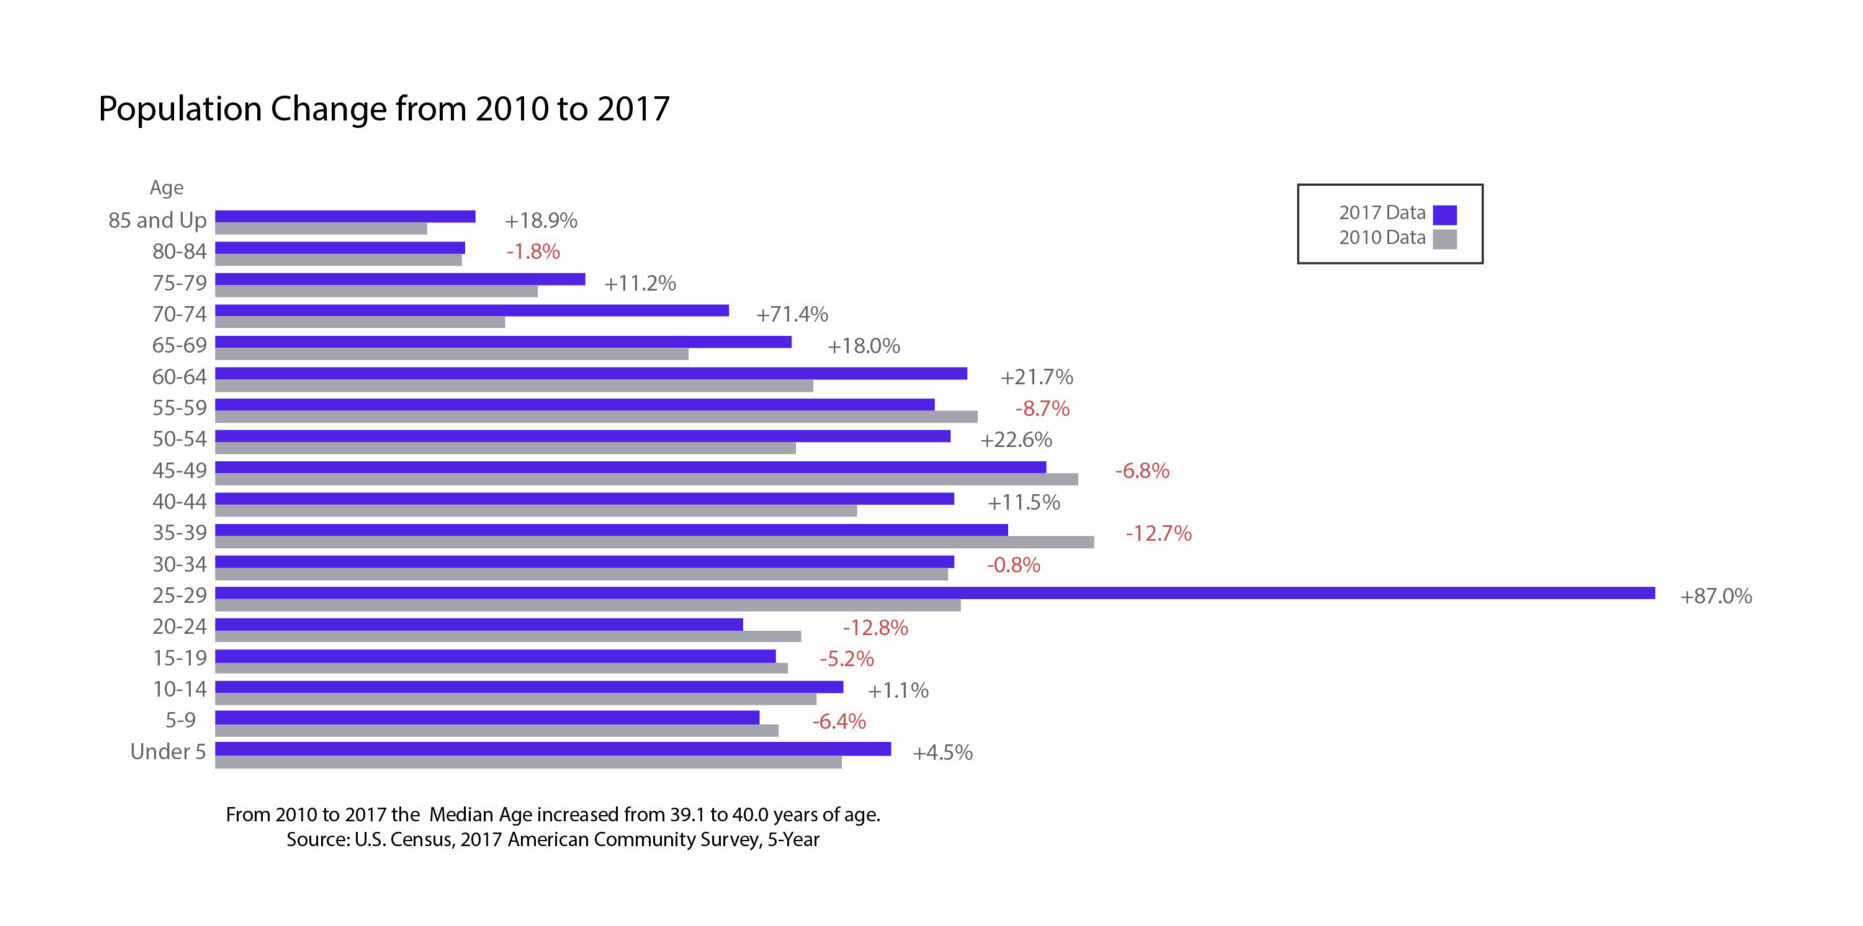
- The two highest growth rates, during that time, were young people between 25 and 29 (87%) and seniors between 70 and 74 (71%).
- From 2010 to 2017, Area 11’s median household income dropped from $63,073 to $61 521.
- As these demographics shift, a growing number of households are making less than the 2010 median Area 11 income of $63,073.
- In 2017 40% of residents made less than $1,250 per month while the average rental in Area 11 is $1,060.
Housing
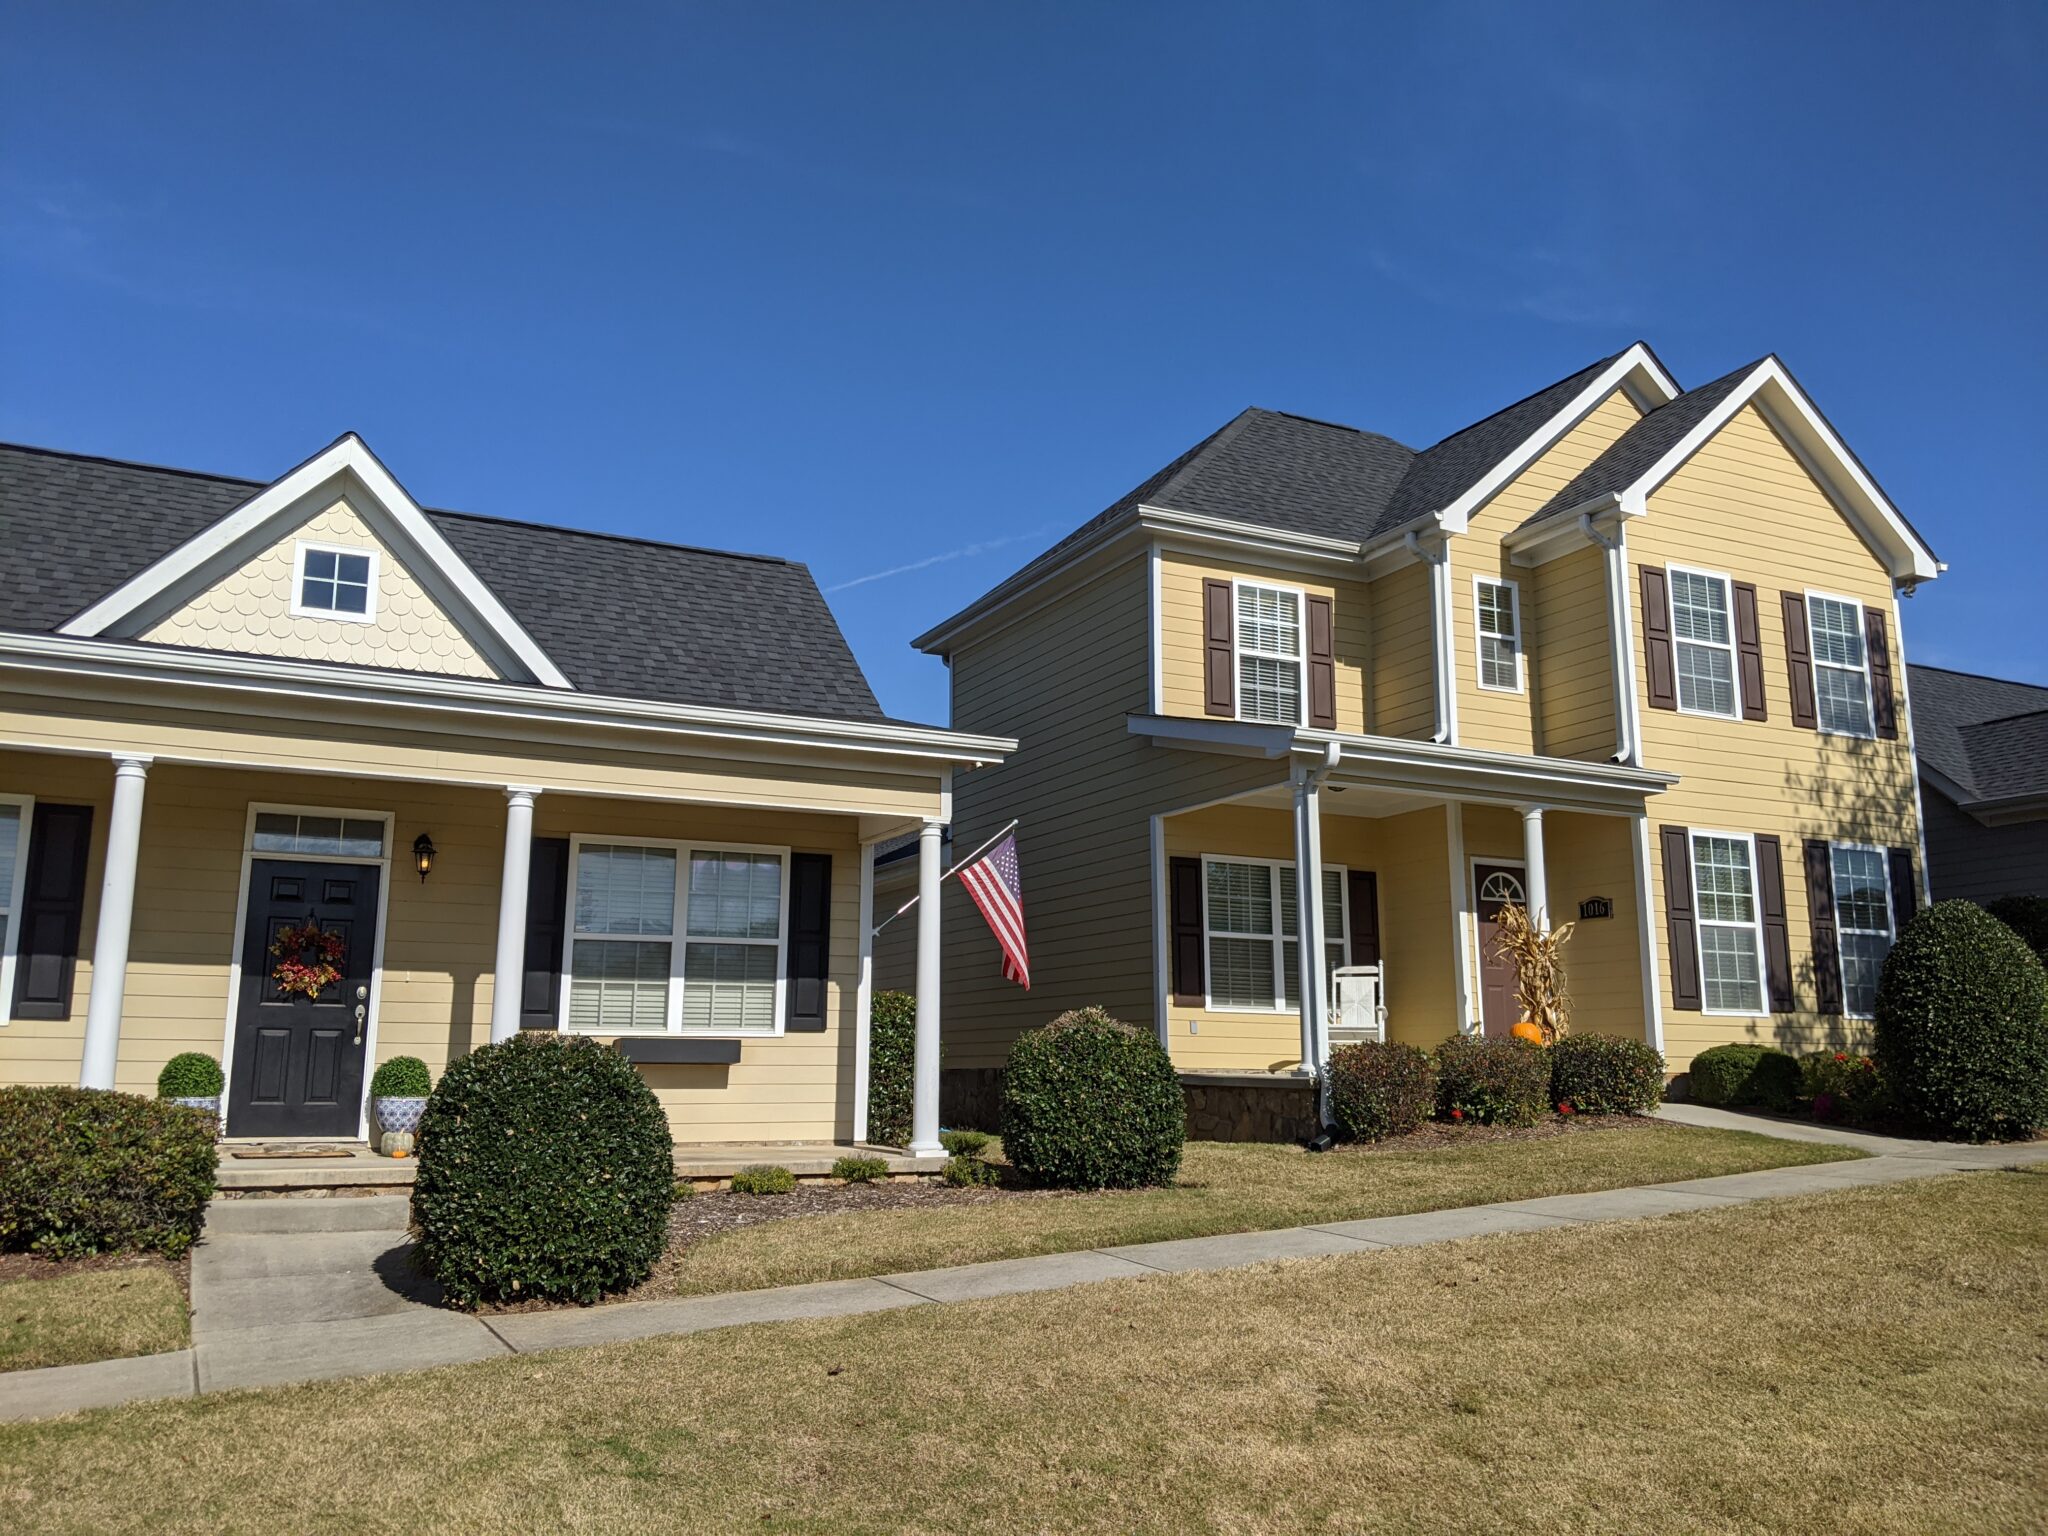
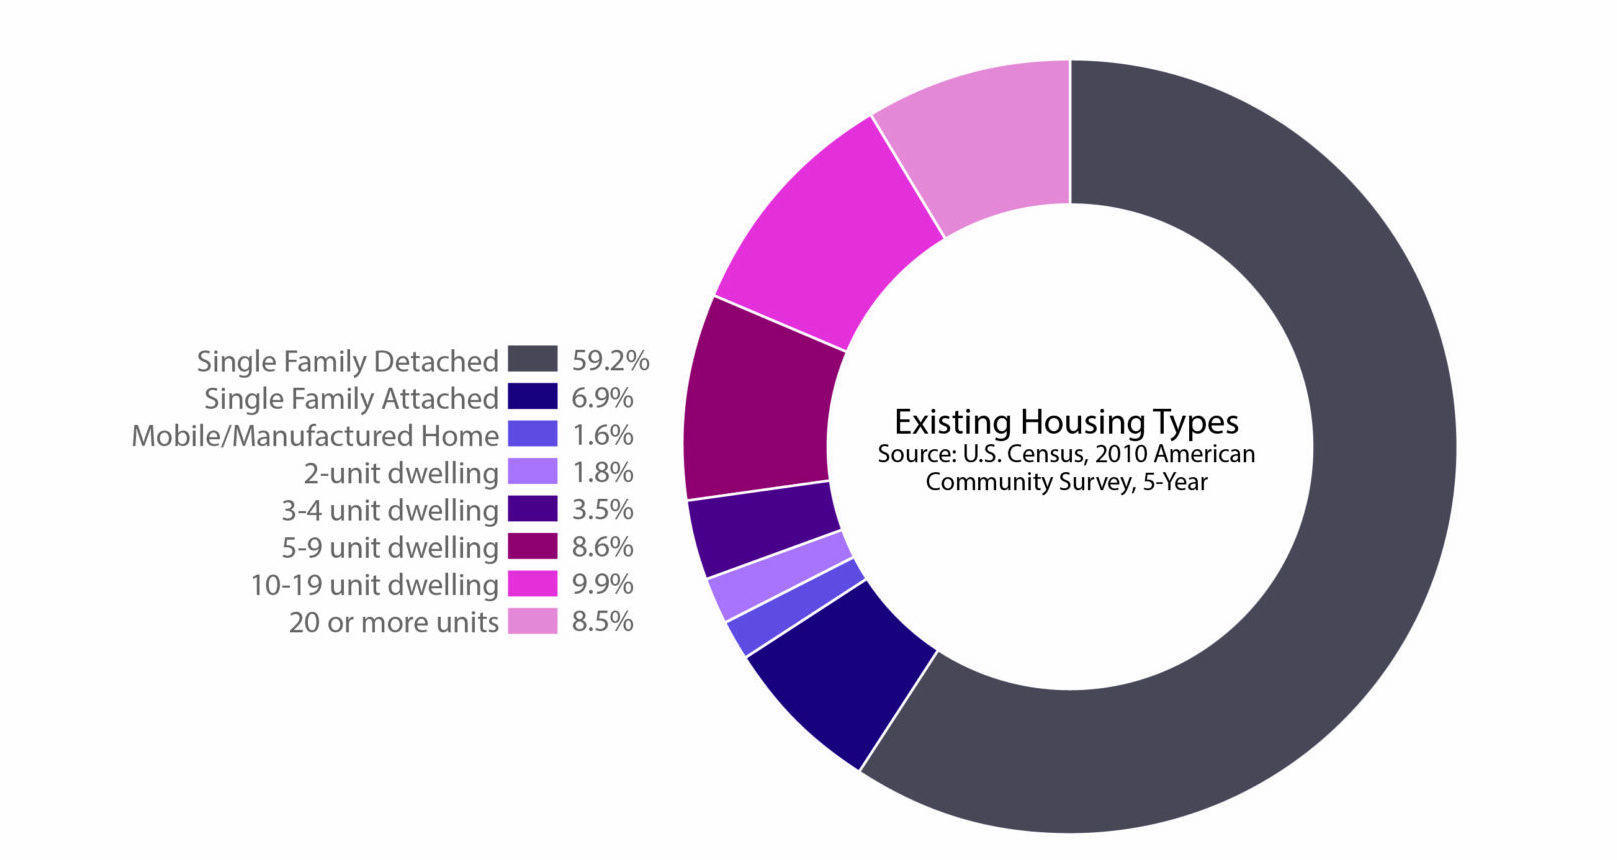
- Roughly 2/3rds of the existing homes are single-family houses with three or more bedrooms.
- Single householders living alone account for 30% of all residents in Area 11.
- From 2010 to 2017, 70% of new housing construction in Area 11 was single-family homes.
- Demographic shifts toward more seniors and younger people point to a potential need for a greater diversity of housing choices in Area 11.
Commercial Trends and the Built Environment
Existing Conditions Report Chapter 4
Commercial Development in Area 11 is where there is a concentration of destinations; employment, shopping, goods and services. There are various commercial development patterns from more walkable, small scale, mixed use to more drivable, retail dominant destinations. Recent trends in commercial development are likely to have significant impacts on Area 11.
The Built Environment is a term used to describe all the buildings in a community, as well as the infrastructure – streets, sewers, schools - that supports them. It is both influenced by, and has an influence on, market trends, shopping patterns, transportation, and public health.
Businesses
- The C-2 zone covers most of the commercial corridors in Area 11. While the C-2 zone has a wide range of commercial uses, it has very limited standards for landscaping, signage, building form, and pedestrian amenities that promote quality development.
- While a majority of the Area 11 Kickoff Survey respondents said they preferred walkable retail destinations, the current zoning – which regulates how things are built – promotes drive-and-park retail development patterns.
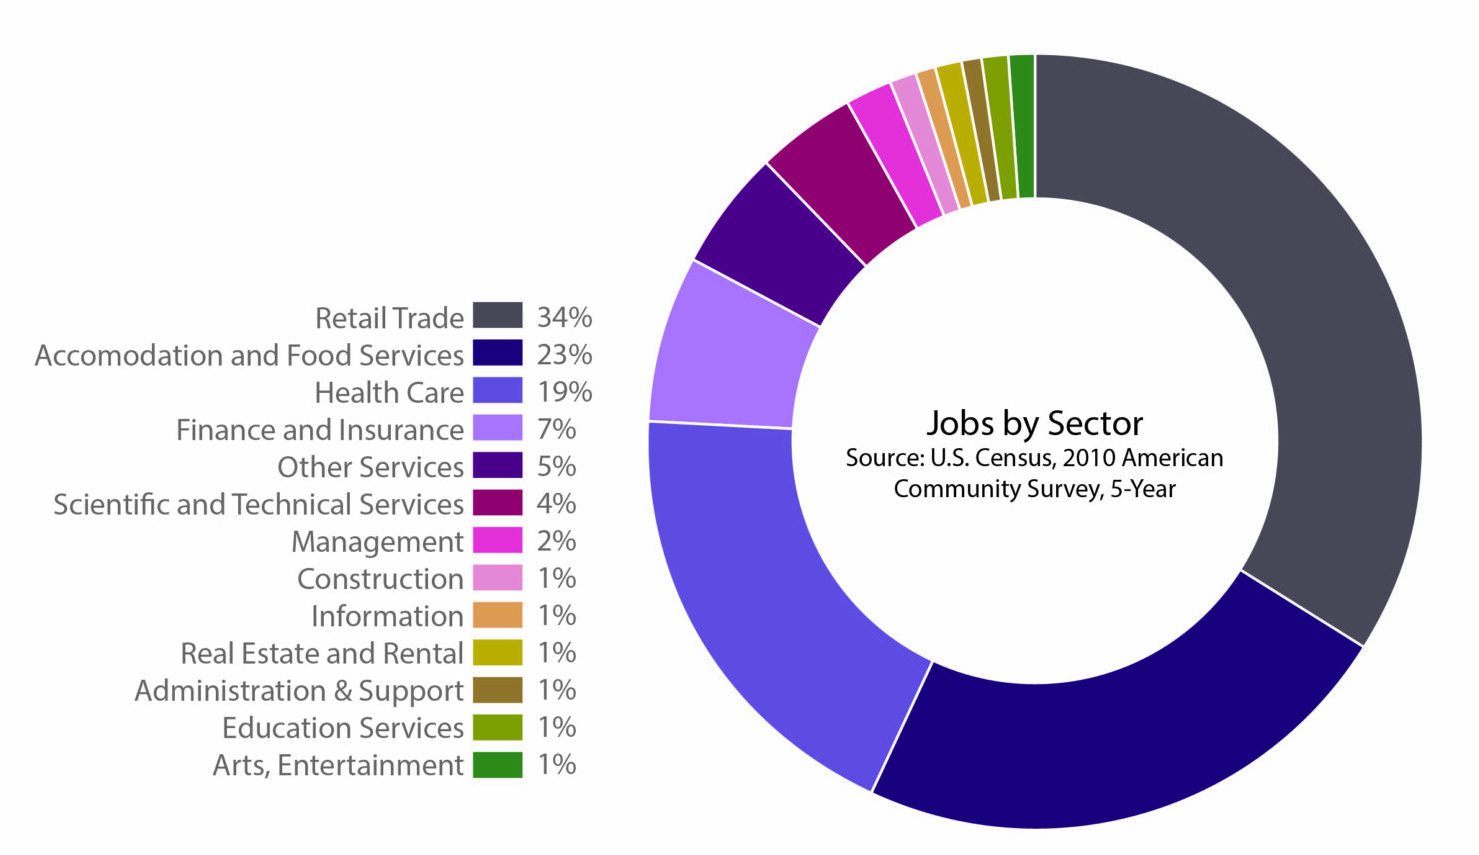
- Retail, accommodations and food service, and health care comprise 76% of all jobs in Area 11.
- The bricks-and-mortar retail industry has not been performing well due to the rapid growth of online shopping, which has been accelerated by Covid-19.
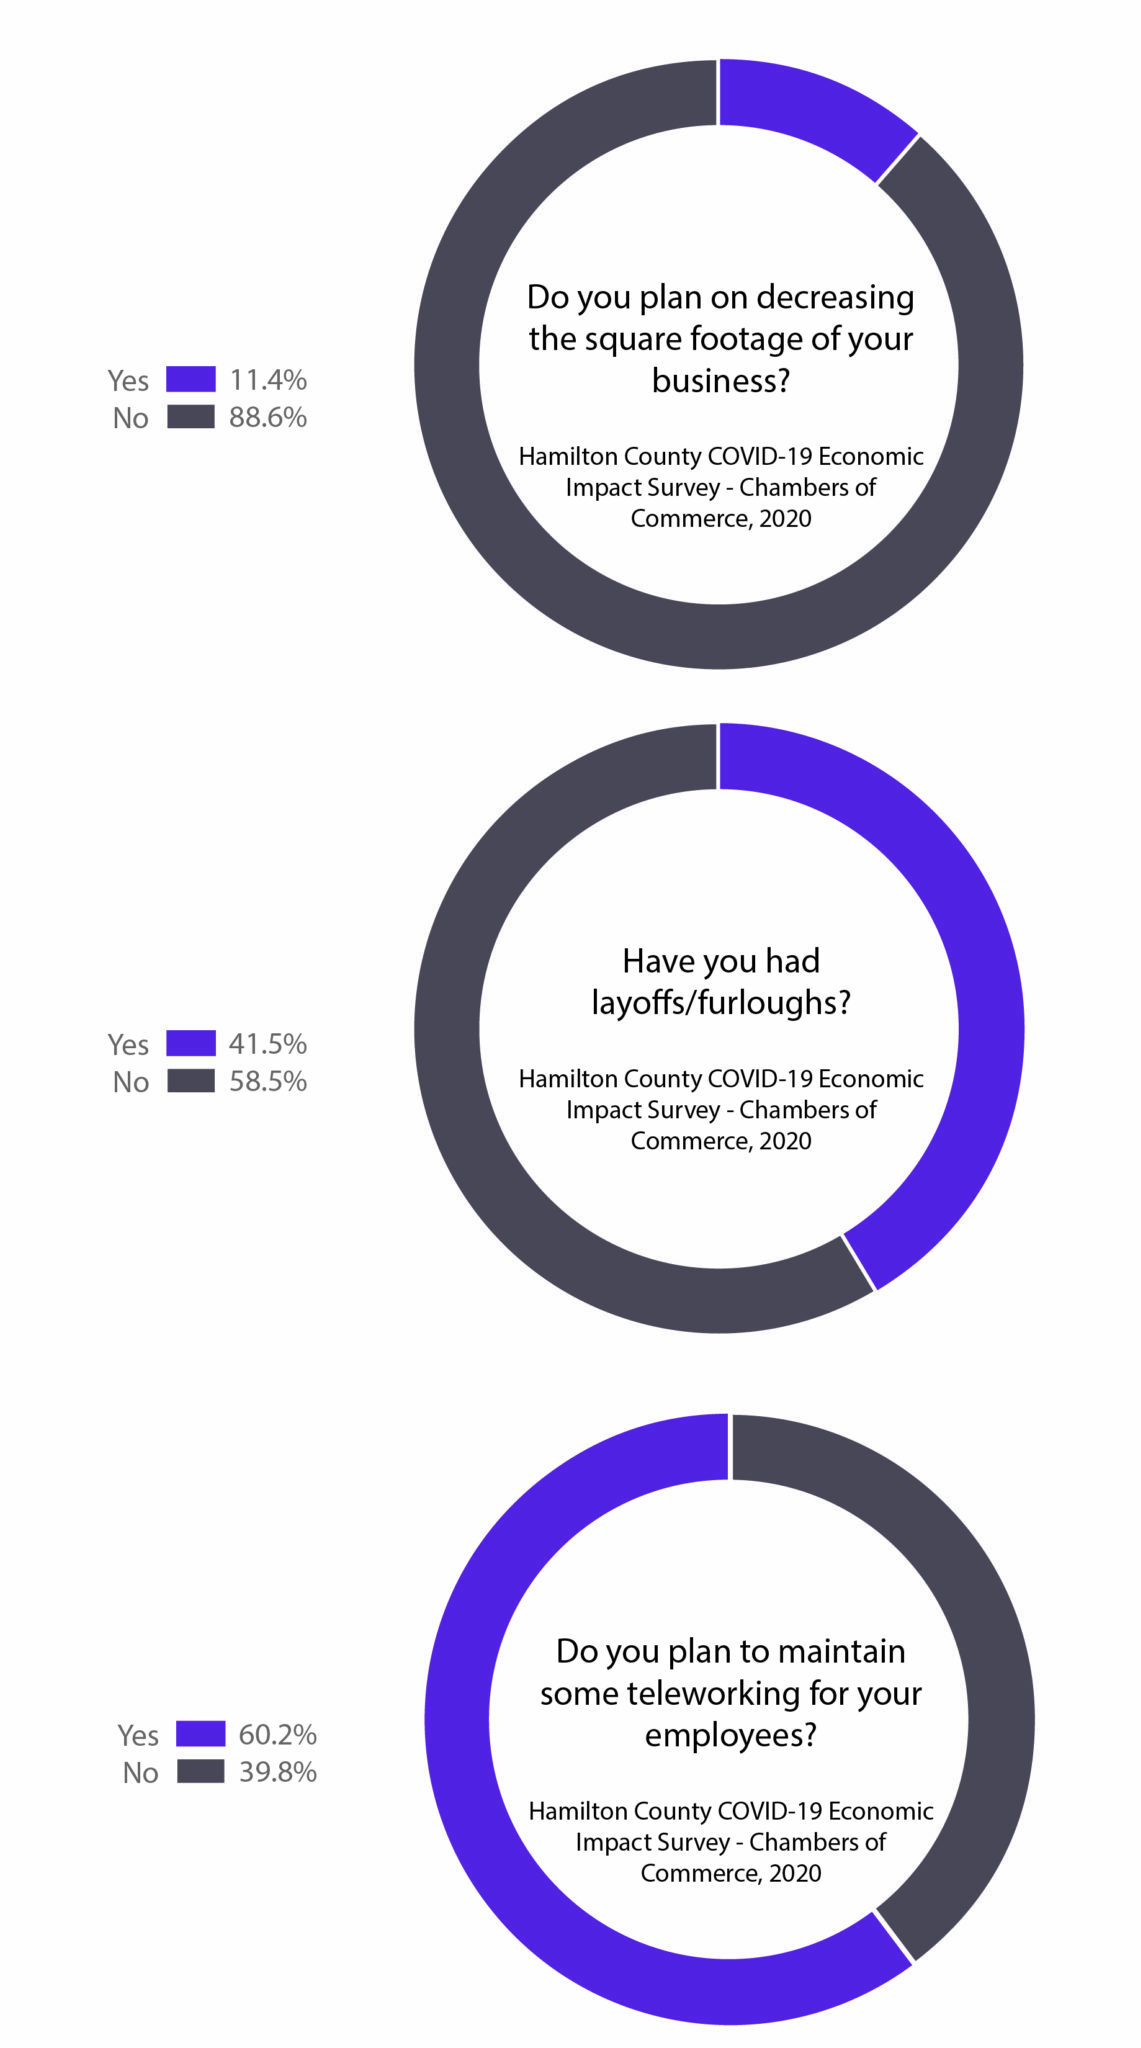
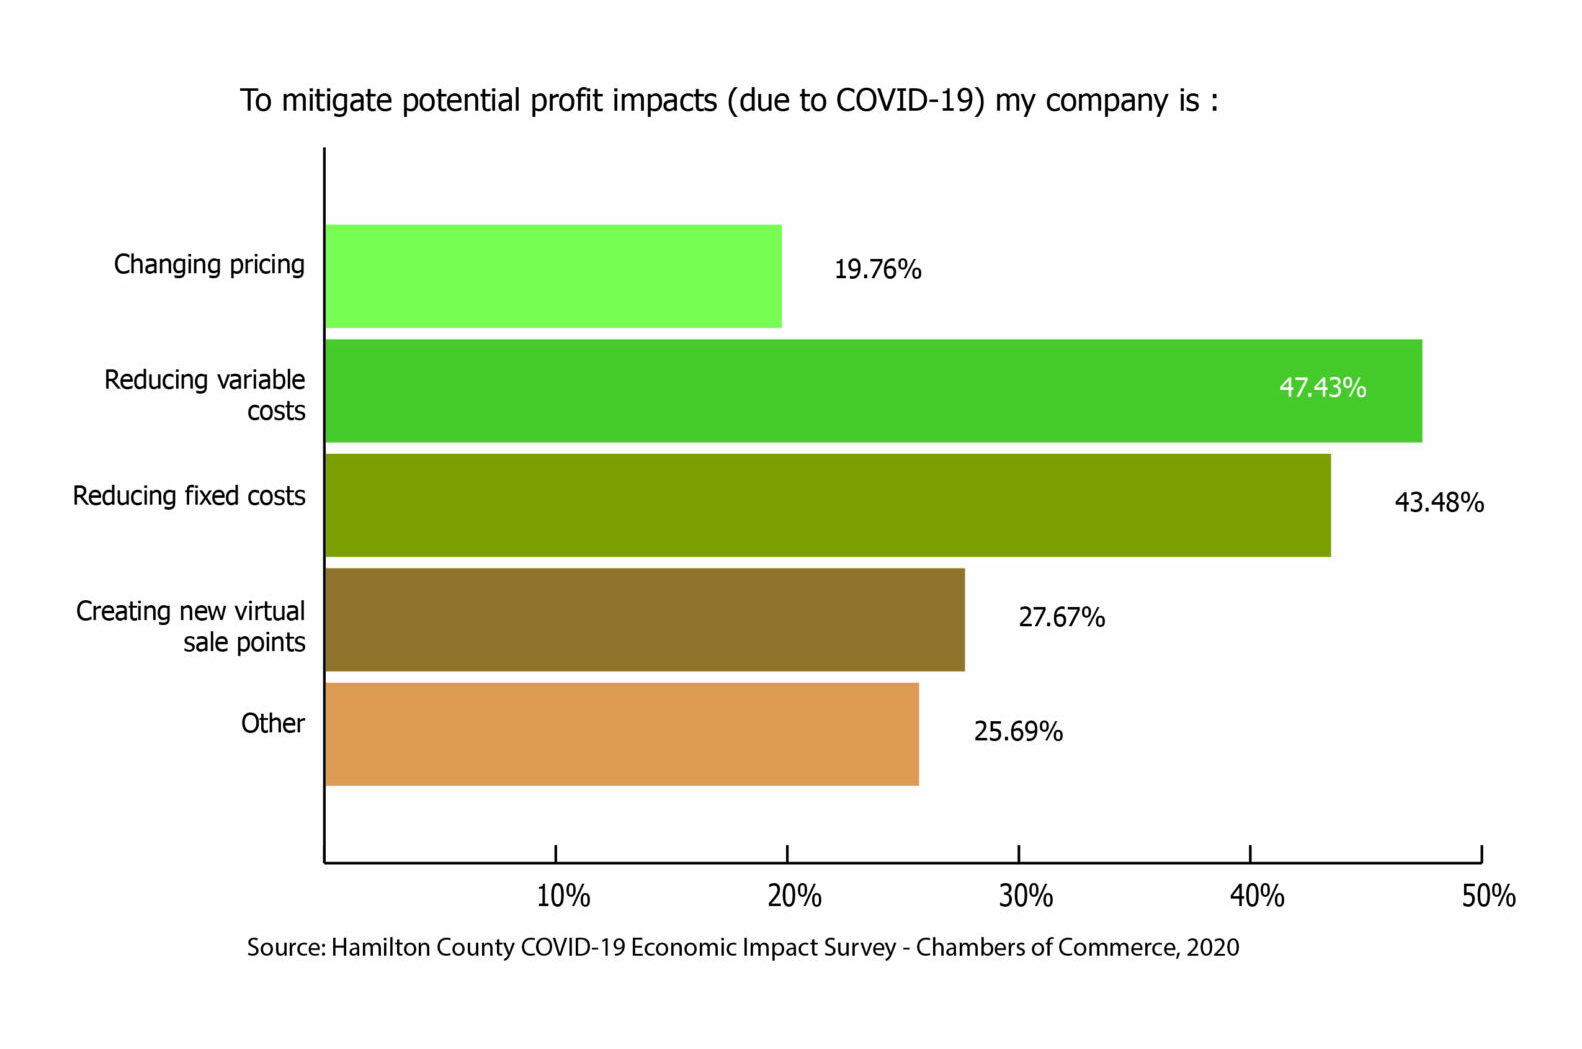
- According to a recent Chamber of Commerce study on the economic impacts of covid-19, there is a trend towards smaller footprint buildings and more telecommuting.
- According to a Chamber of Commerce survey, 60% of Chattanooga businesses say they will continue to provide telecommuting as an option for employees after the pandemic, and 11% say they plan on decreasing the square footage of their business.
Suburban Commercial
Commercial development in Area 11 tend to be characterized by
- Uses limited to retail, restaurants, services, but no mix of housing;
- Typically chains, and "big box stores";
- Long blocks;
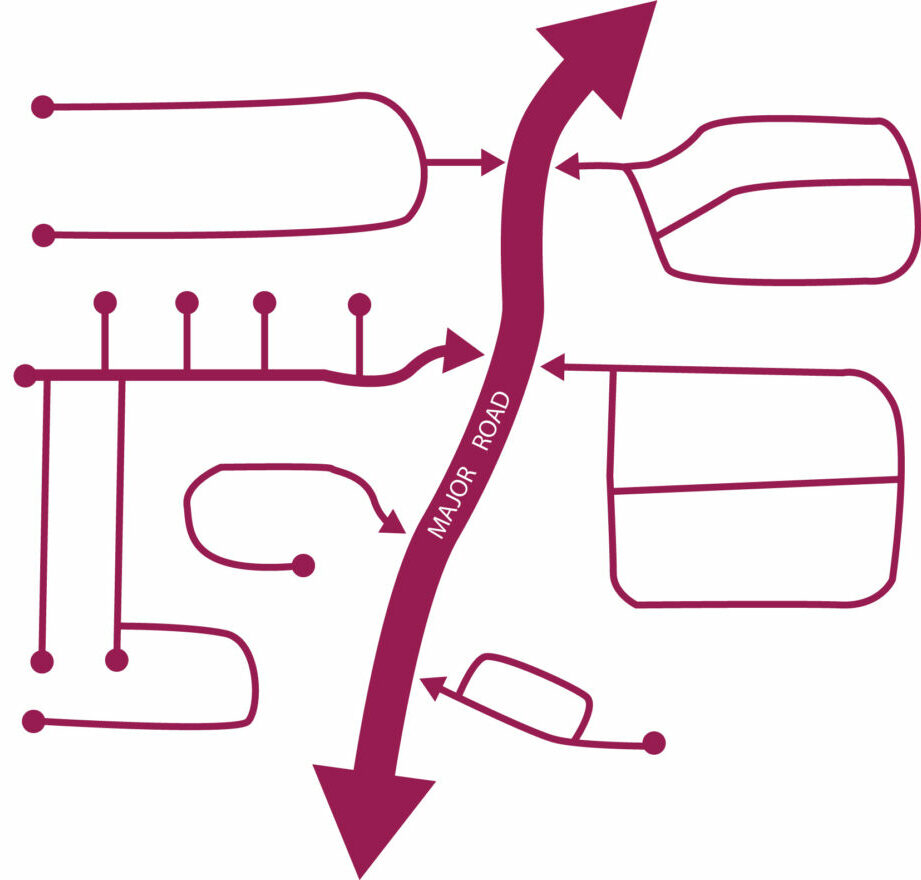
- One main street with limited connections to surrounding neighborhoods;
- Limited sidewalks, often with no connection to the street, or between buildings and outparcels within larger sites;
- Large, single-tenant parking lots in front of the buildings;
- Limited outdoor public gathering spaces, such as greens, squares, and plazas.
Transportation
Existing Conditions Report Chapter 3
The transportation network includes all (streets, sidewalks, bike paths, traffic signals, and buses) that help people reach their destinations and daily needs. The section below covers key issues related to to the transportation infrastructure in Area 11, including maintenance, congestion, and the road network.
Funding Prioritization
- The Regional Transportation Plan is responsible for prioritizing all federally-funded transportation infrastructure projects.
- Road widening (adding new lanes) or road extensions (new streets) projects are expensive and often compete for limited federal and state funding.
- One lane mile (a single lane of traffic) costs about $351,000 to resurface and $1,466,000 to re-construct (Highway Economic Requirements System, 2012).
- The City is responsible for maintaining 2,327 lane miles (excluding state routes and highways). Roughly 8% of these lane miles are in area 11.
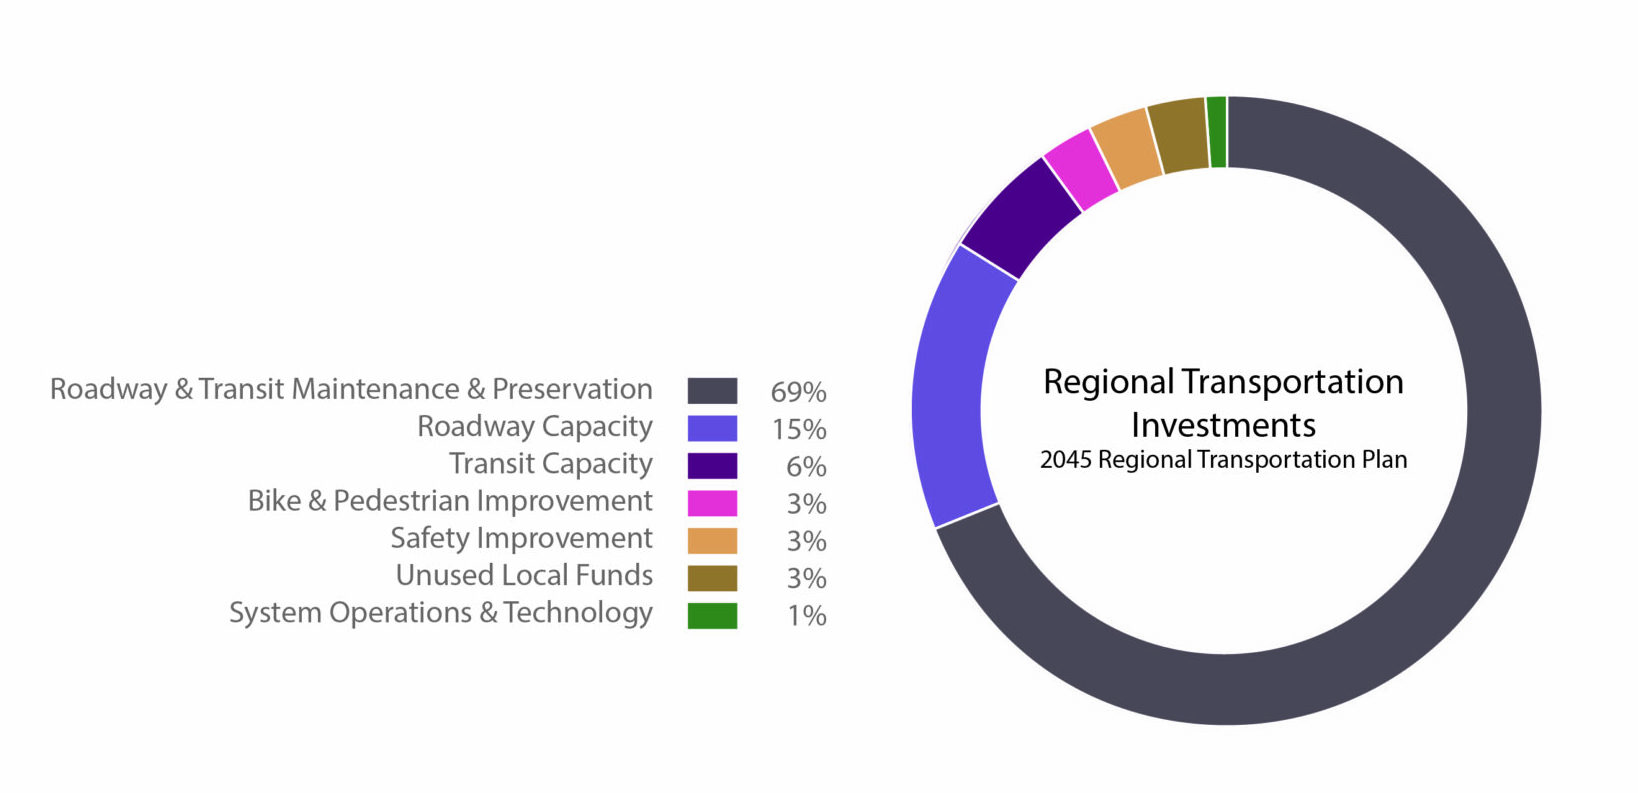
- Budget priorities in the Regional Transportation Plan (RTP) have shifted from new road construction and widening to maintenance of the existing system, with 69% of the current regional transportation budget allocated to maintenance.
- Chattanooga typically budgets about $500,000 annually for new sidewalks across the entire city, which only pays for about a half-mile of sidewalks.
Congestion
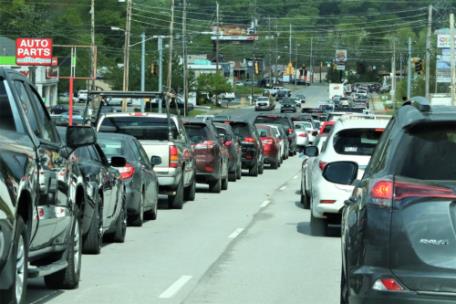
- Traffic modeling from the 2045 Regional Transportation Plan shows that congestion is likely to increase on East Brainerd Road and parts of Shallowford Road near the I-75 interchange (see Congestion Map).
- Several factors contribute to congestion in Area 11 including
-
- regional traffic into and out of the area;
- a disconnected street network with few route options; and
- destinations that are separated from housing and therefore must be reached with a personal vehicle.
Regional Traffic
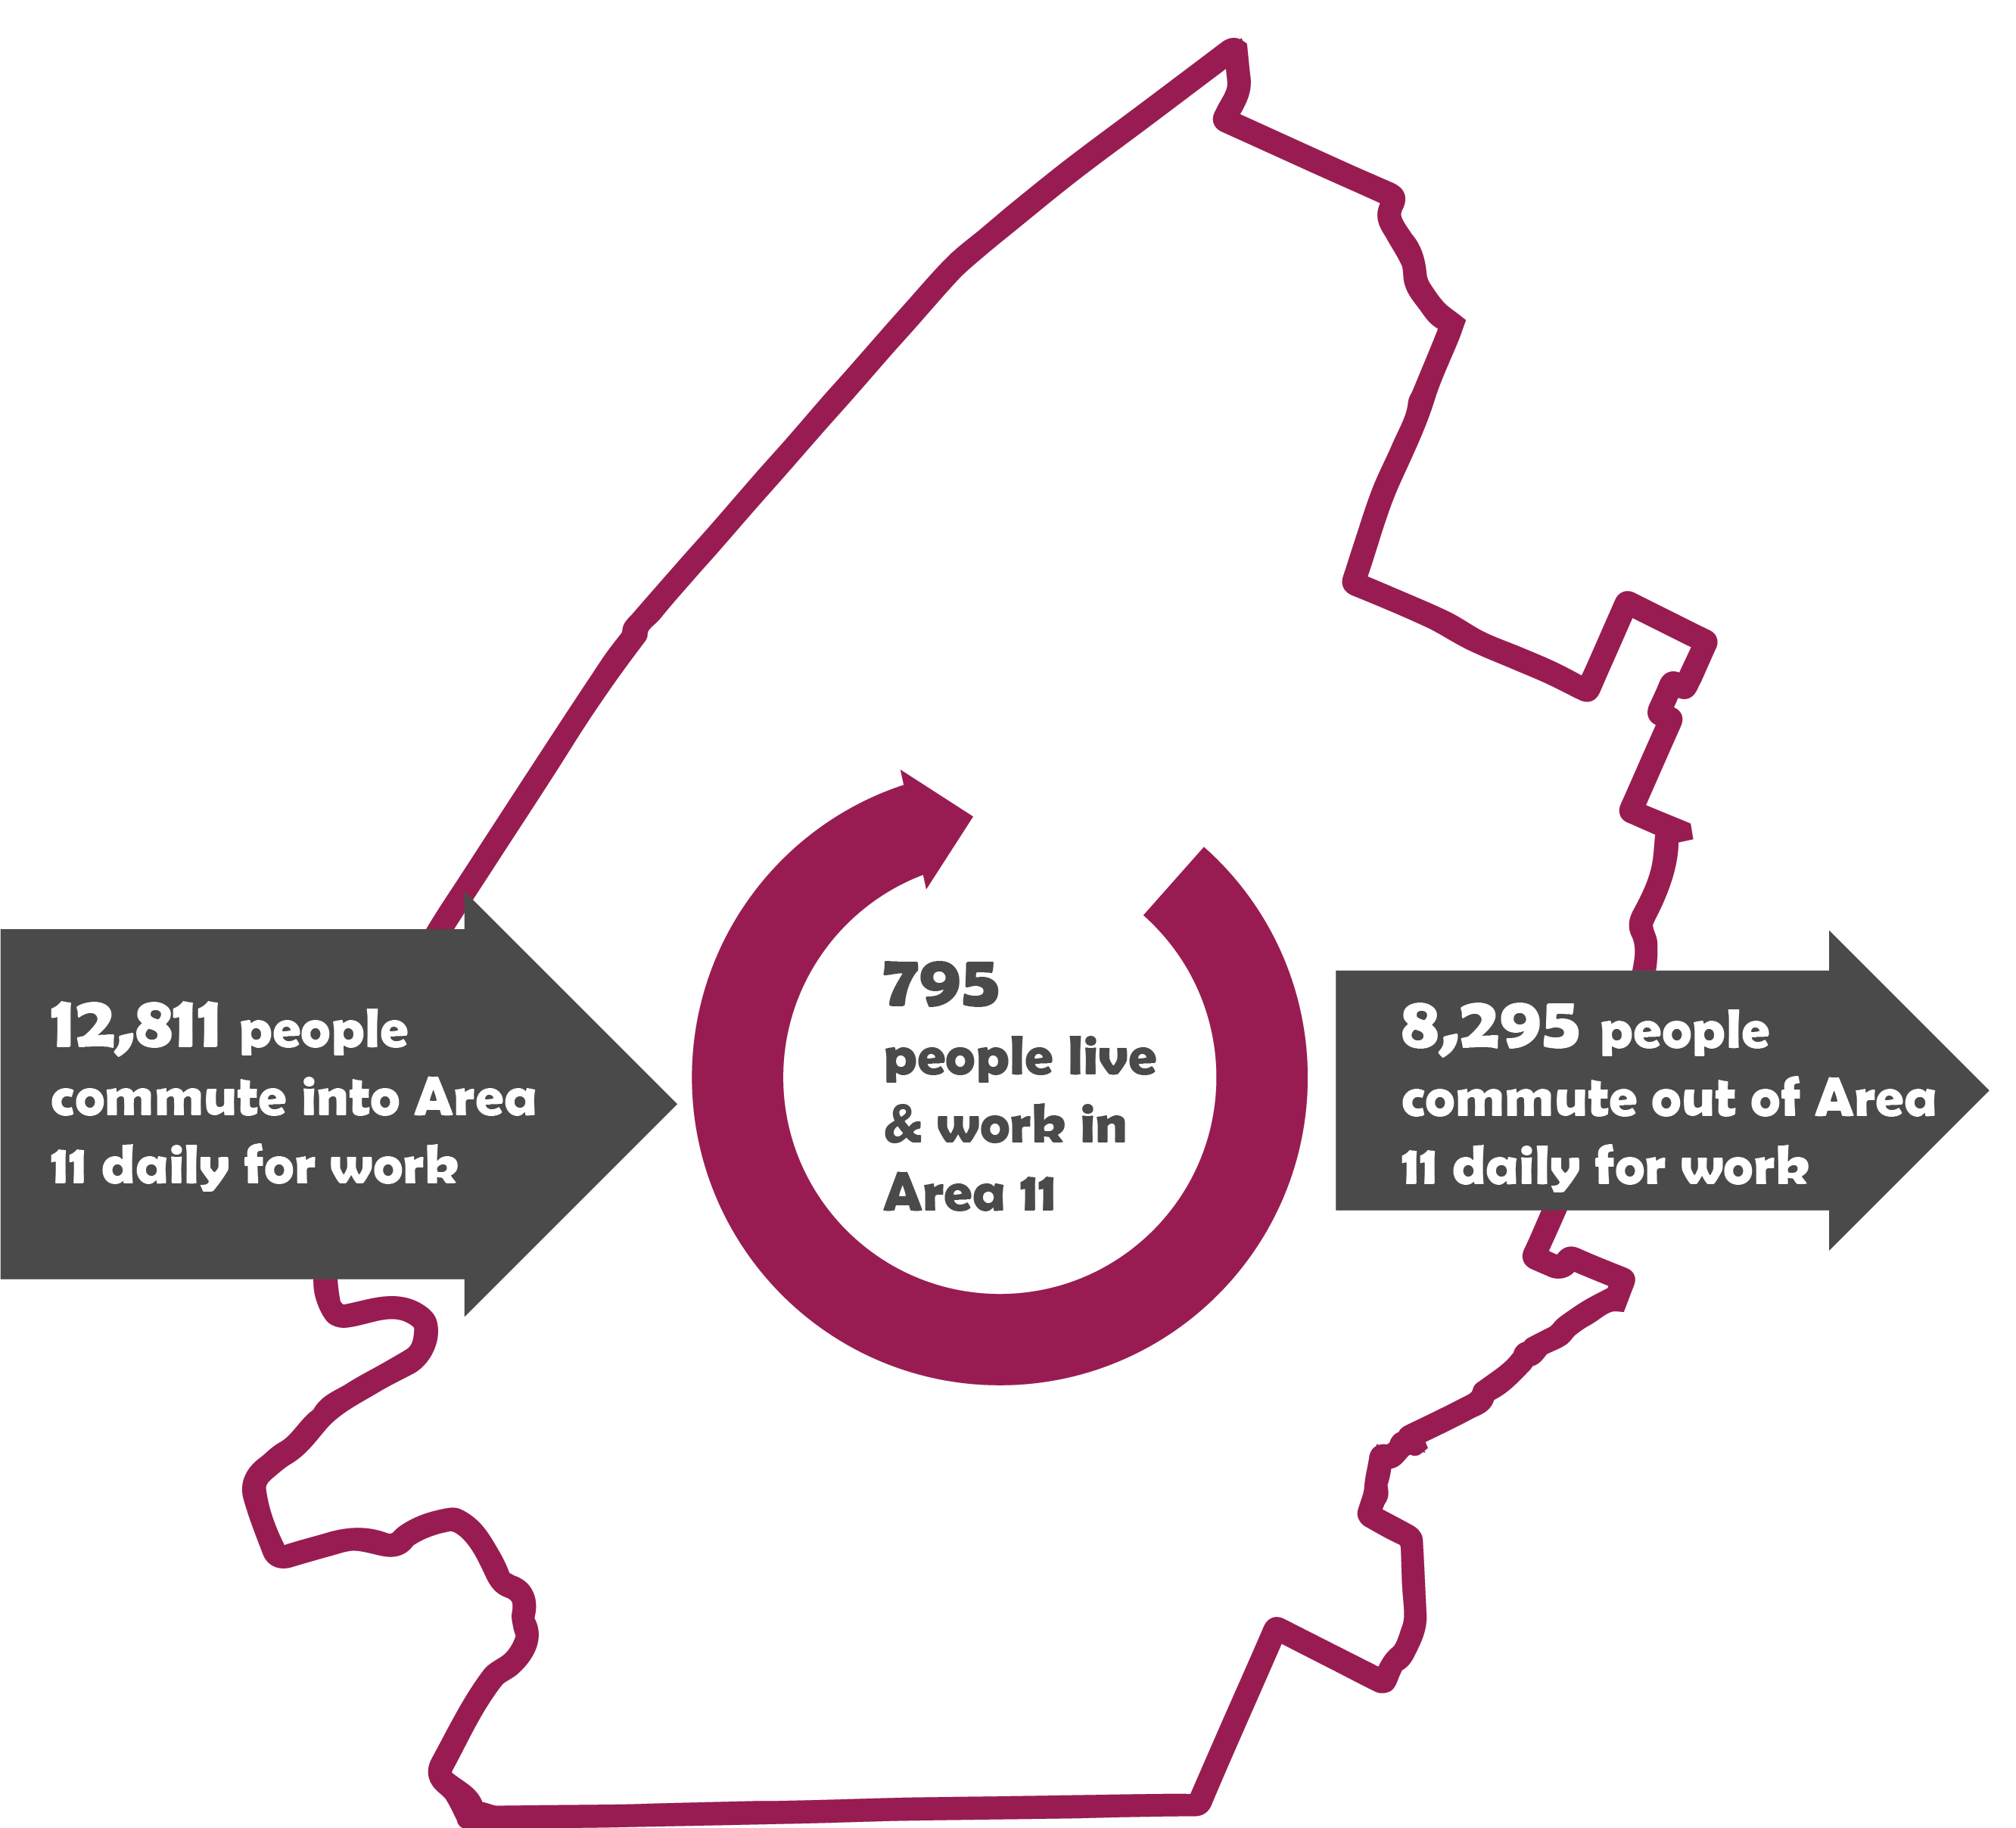
Every day, 12,811 people commute into Area 11 from other locations for work, while another 8,295 residents commute out of Area 11 for jobs located elsewhere. The commuter traffic alone adds 21,106 vehicle trips to the weekday peak hour traffic.
Natural Systems, Parks, and Greenways
Existing Conditions Report Chapter 5
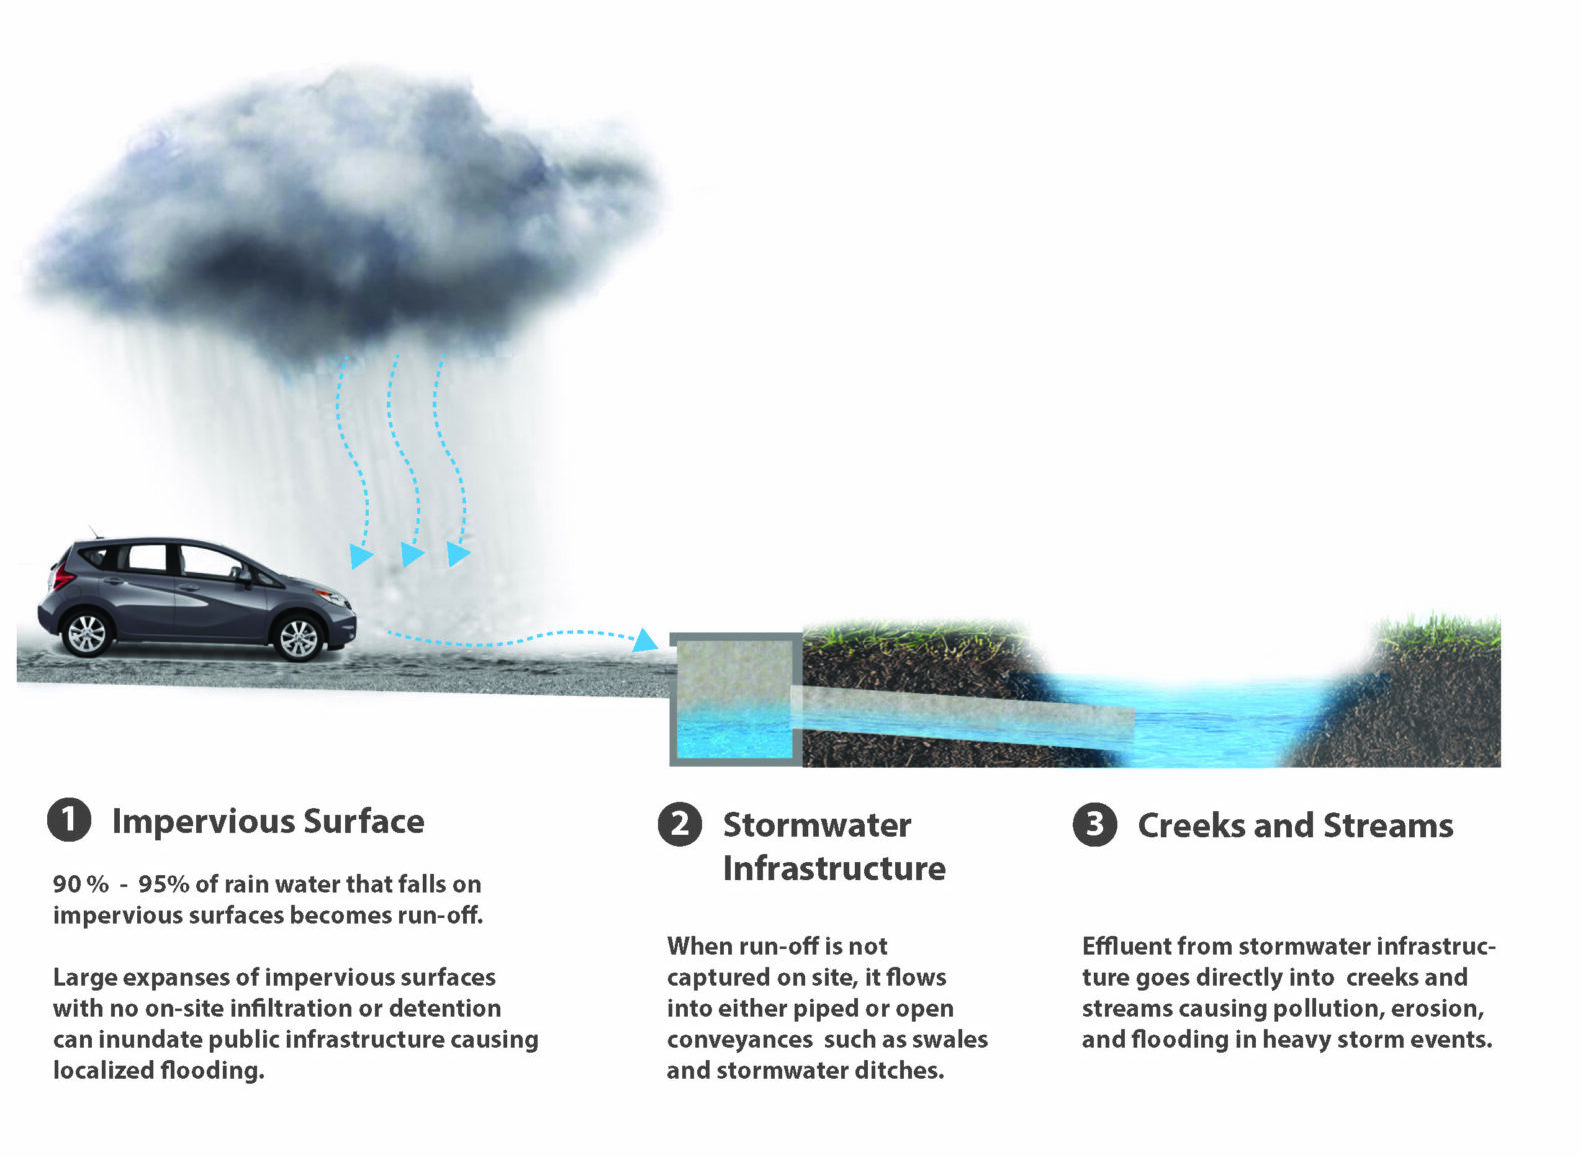
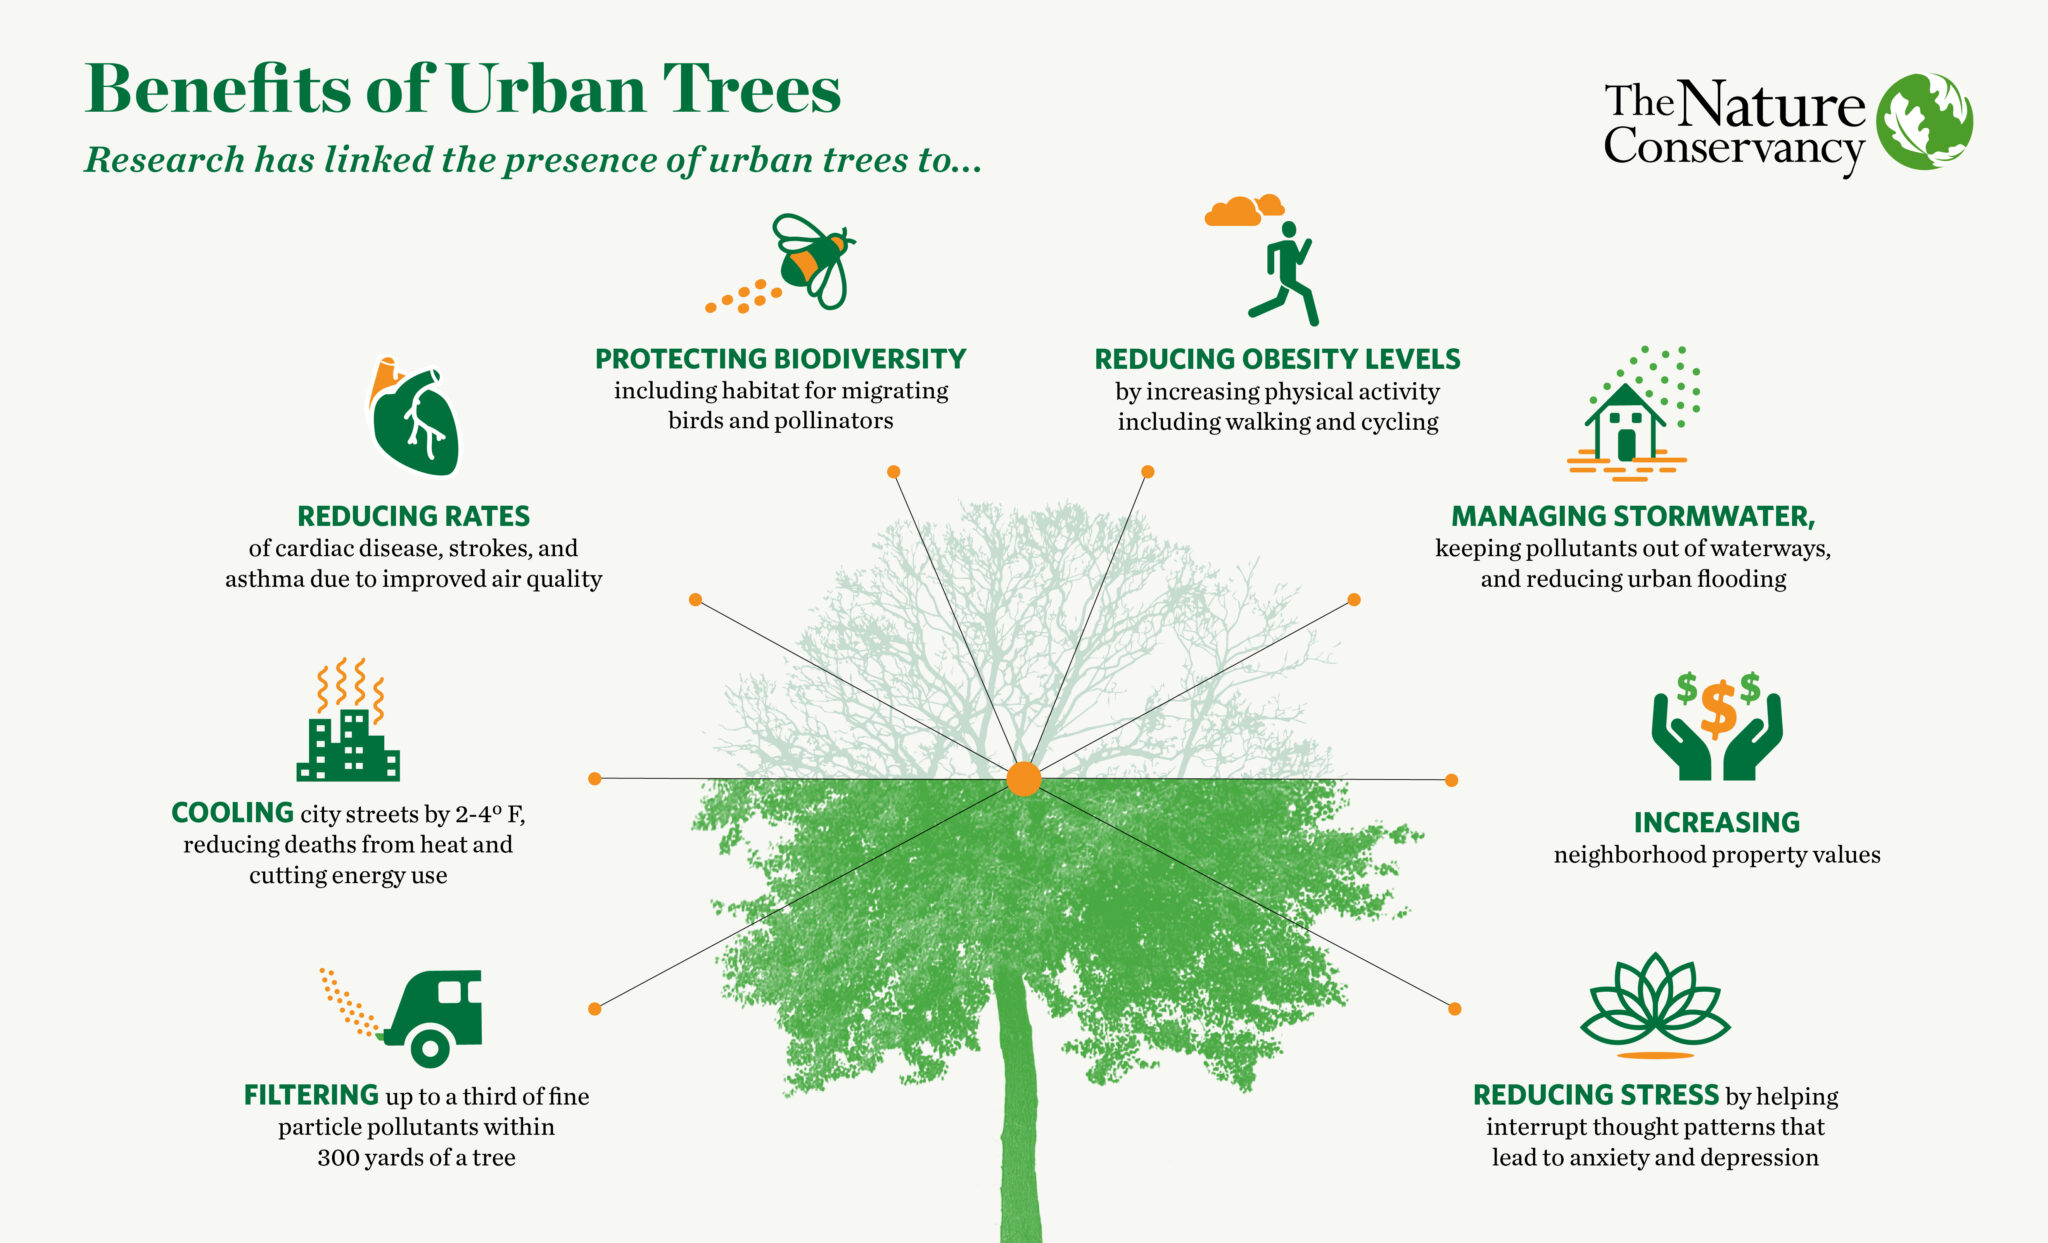
Natural Systems, including water, soils, and vegetation, interact with, and are altered by, the built environment. For instance, impervious surfaces (roads, parking lots) alter the flow of water and increase the volume of stormwater run-off. Natural Systems provide many services and benefits to people, including flood control, cooler temperatures, decreased air pollution, fertile soils, higher property values, and recreation.
Flooding
- Almost 20% of Area 11 is covered by the Special Flood Hazard Area (as mapped by FEMA), which includes the floodway, and the 100-year, and the 500-year floodplain. Of that 20%, 836 acres are developable land.
- Of this 836 acres of developable floodplain, 68% is zoned R-1 Residential for single-family development. This zoning allows up to 5 dwelling units per acre. At this maximum density, 2,842 homes could potentially be built in the 100-year floodplain.
- All structures within the floodplain must be elevated one foot above the 100-year floodplain.
- Much of the 100-year floodplain in Area 11 is dotted with wetlands, where fill is not permitted, making new development challenging.
- Area 11 is covered by 1,150 acres of impervious surface, which equates to 15.8% of the total land area.
- Much of the impervious surface in Area 11 was built before regulations for on-site stormwater detention went into effect in 2014.
Parks
- Area 11 has three publicly accessible parks totaling 105 acres, which equates to 4.89 acres of park space for every 1,000 people living in Area 11.
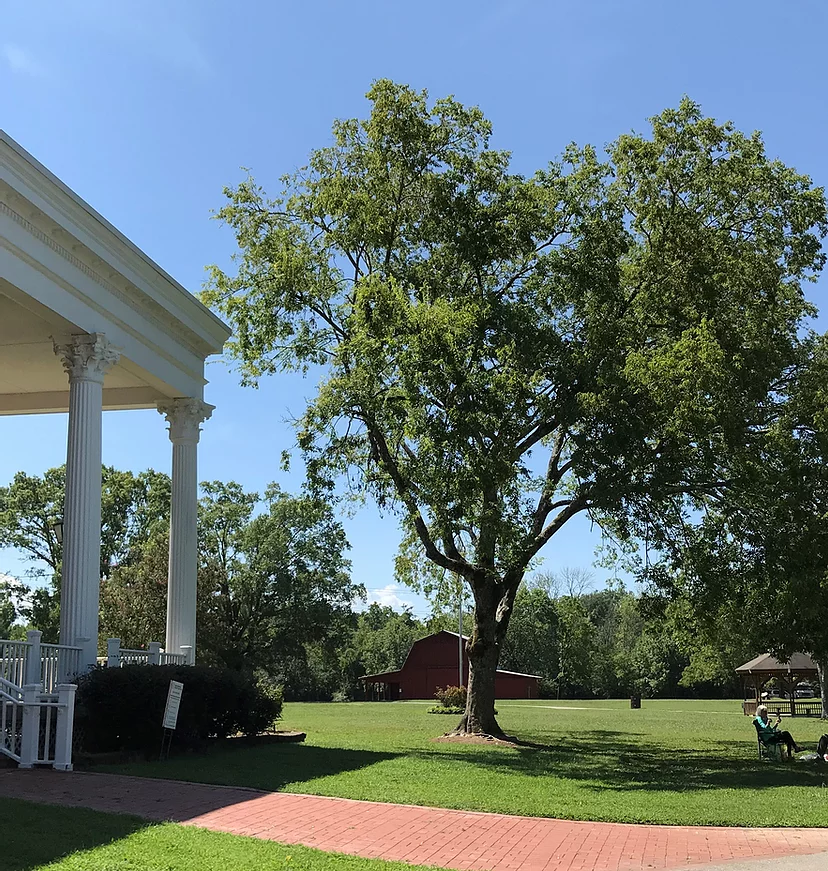
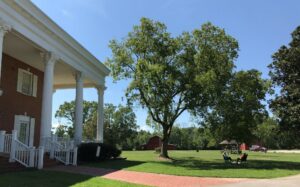
- Jack Benson Heritage Park is a 22-acre park that includes playground equipment, walking trails, a dog park, and the house, which can be rented for private events. Mature trees are found throughout the park. Two tributaries of South Chickamauga Creek - Mackey Branch and Ryall Springs Branch - meander through and adjacent to the park.
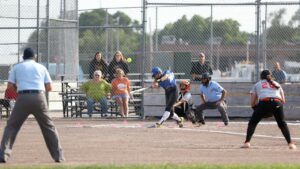
- Ballfields, tennis courts, and a large parking area make up the 35-acre facility at Batter’s Place. The ball fields are maintained by the Youth Athletic Association, while the tennis courts are maintained by the City.
- Audubon Acres is privately owned and managed by the Chattanooga Audubon Society. Forty-eight of its 130 acres are in Area 11. Audubon Acres features a cabin and a cultural center that focuses on Cherokee history and early settlements. The park is known for its horticultural diversity and serves as a learning center and preserved riparian area.
Trees
- The mature tree canopy covered approximately 5,399 acres, or 74%, of Area 11 prior to the April 12th, 2020 tornado.
- A 2010 report by the National Recreation and Park Association estimates that trees in U.S. city parks remove 80 pounds of pollutants per acre per year. This means the tree canopy in Area 11 (prior to the tornado) removed about 431,920 pounds of air pollutants annually.
- Area 11 suffered a significant amount of tree loss from the April 12th tornado. While an official assessment has not yet been done for Area 11, it was estimated that 5,100 acres of vegetation, over the nine-mile tornado path was severely impacted (Skytec, 2020)
Map Links
Demographics: Chapter 2
Transportation: Chapter 3
- Projected Congestion
- Bike Facilities
- CDOT Resurfacing Projects
- EMS Coverage
- Fire Station Coverage
- Pedestrian Facilities
- Street Network
- Traffic Volumes and Road Classifications
- Walkshed to Destinations
- Walkshed to Transit
- Tornado Path and Street Network
Built Environment: Chapter 4
- Building Permits
- School Zones Elementary
- School Zones Middle
- School Zones High
- Vacant Land
- Sewer Lines
- Zoning Cases
- Zoning
- Land Use
Natural Systems, Parks, and Greenways: Chapter 5
---
Go to the Top


WHAT DO AREA PLANS DO?
Once the Area Plan is adopted by the City Council, it will:
- Identify COMMUNITY VALUES and establish a SHARED VISION through a robust public engagement process.
- Provide an ANALYSIS of EXISTING CONDITIONS, such as demographics, transportation, jobs & housing, natural resources and development trends.
- FOCUS ON PHYSICAL DEVELOPMENT, including natural resources, the built environment, transportation and infrastructure.
- Guide development by recommending the location of specific PLACE TYPES.
- Influence the prioritization of GOVERNMENT SPENDING for public projects.
- Inform PRIVATE investors looking for DEVELOPMENT opportunities.
ARTICLES & RESOURCES
Check back occasionally for informational articles and websites.
MEET THE TEAM
Click on a name for bios.
Karen Hundt
Community Planning and Design Director
Pam Glaser
Principal Planner
Go to the Top
---
Questions?
Contact Eric Matravers - Area 11 Project Lead areaplan@chattanooga.gov | 423-643-5920


